NAEP scores
My ramblings on standardized testing.
Willy Viv
6/23/20236 min read


As I was preparing to run a different post for my first contribution to this blog, a ton of positions about NAEP score declines populated the news and my social media feeds. It feels most pressing to also jump in with a slightly different take. The approach of this arm-chair psychometrician (me) avoids attending to what the NAEP scores actually mean in terms of moving downward. Instead, I raise concerns about over-interpreting the scores, and finish up with a Desmos activity that automatically assesses student submissions to address my concerns a bit.
A moment of transparency
I am skeptical about the finality of conclusions that people draw from test scores. To be sure, there is a science behind test making and it can provide valuable information. My reluctance to embrace test scores as the primary measure has to do with the fact that a score is a summary of some kind. Does the drop in NAEP scores suggest some kind of math improvement trajectory loss or disruption? It probably does to some degree. As a summary value that changes over time, we can get a sense of general patterns. I agree that students who excel in the math content area should be able to earn a high score regardless of how novel the problems are. This means that students who are engaged with the math over an extended period of time, are familiar enough with the intricacies and possible special cases to navigate unfamiliar problems. I take issue with using a single standardized test score (or average of a set of single scores) as the authority on student learning or knowledge because it is not as sensitive a measurement as it should be if we uphold it as an absolute declaration of knowledge. If pressed, I would conceded that standardized test scores are good, if not great summaries of students at the top and the bottom (but I am not being pressed to take a position on it, so you didn’t just read that). But what about the students in the middle 20-80-ish%? I’m not convinced that these scores really tell us as much about the middle performing students as they do about those on the extremes. In 2007, the American Institute of Research (a more reliable interpretation of NAEP than I have done) posed that some issues exist in the NAEP assessments and framework, arguing that there were not enough easy questions to adequately measure lower-performing students’ knowledge (https://www.air.org/sites/default/files/downloads/report/Daro_NAEP_Math_Validity_Study_0.pdf), so I guess they disagree with me on the lower extreme. Still, the point is that standardized tests may not be consistently good measures of performance across levels.
I think test scores are similar to polls and surveys that make statements about the population. Who will win the next political election? How much exercise/sleep do people in the US get? A margin of error (a buffer to help capture the true value) is always included in such data reporting. Learning and knowledge are not as easy to measure as hours of sleep, for example, and the average hours of sleep people in the US get gives individuals a point of comparison for themselves. Elections eventually occur and we can see the outcome of the preference of those who voted (the modal value), and people can celebrate or pout about the outcome (or be ambivalent about it, I don’t care). With elections, people can also talk about how close or far off the polls were (see for example: https://fivethirtyeight.com/features/2022-election-polling-accuracy/). Those who develop guidance for NAEP exams recognize this “since the set of content objectives described in chapter two would constitute too many items for a single test given to all students, the design of NAEP allows for matrix sampling. This means that there are multiple forms of the test. Items are distributed so that students taking part in the assessment do not all receive the same items” (https://www.nagb.gov/content/dam/nagb/en/documents/publications/frameworks/mathematics/2022-24-nagb-math-framework-508.pdf, page 63). Therefore, scores tell us something, but we should probably hedge a little when we decide to draw conclusions about what students know.
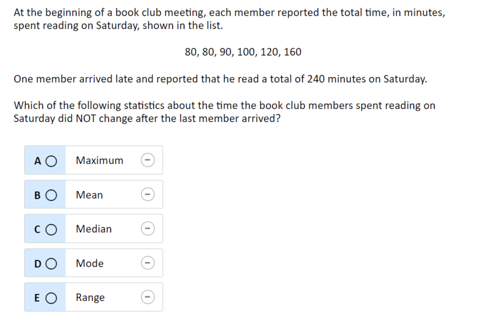
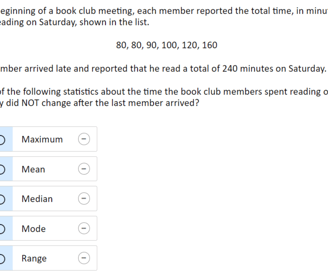
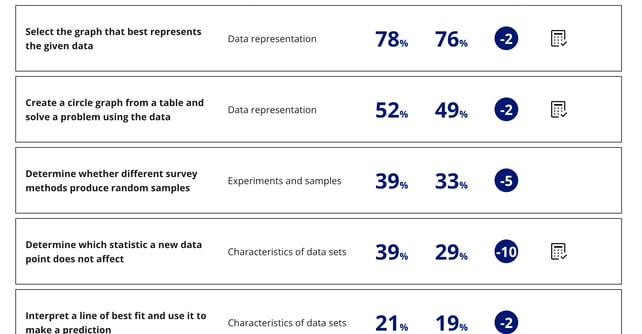
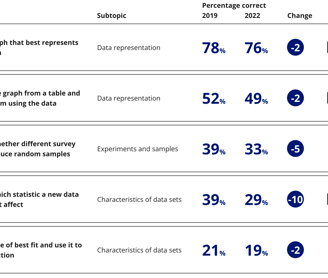
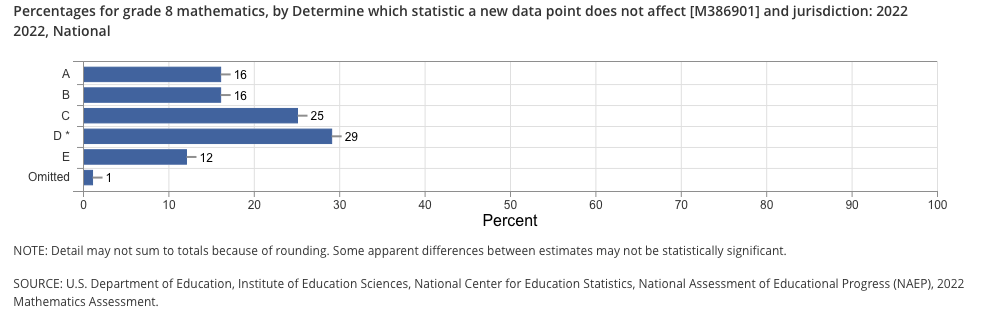
The largest percent drop in math for 8th graders seems to be a category that asks students to “determine which statistic a new data point does not affect” (see Figure 2). Figure 1 provides the example problem released by NAEP for this category. This question from the NAEP exam asks students to identify whether the maximum, mean, median, mode, or range of the data are changed when a new and larger value is added to the data. Spoiler: the answer is the “mode.”
Figure 1 Retrieved from https://www.nationsreportcard.gov/nqt/searchquestions on 6/21/2023
I am intrigued by a few things about this released exam problem and the answer choices. I would guess that the intention of this question that a student who understands these five summary statistics will choose the correct answer because they have deemed the other solutions incorrect, so some people might suppose that competency in each of these measures is equally evaluated. Suppose, however, that a student selected “median” because they checked “maximum” and “mean” and knew they were not correct and did not fully understand median. By choosing the wrong answer they are given no credit for what they did know! I understand this is how testing works to keep the number of exam questions to a reasonable number and we can draw reasonable conclusions based on a large enough data set. My point is, these test scores are summaries and do not capture the whole story. (And I also think that teachers can do a really good job of capturing a larger portion of the story, especially when they focus on what students do know, rather than what they don’t… more on that later).
Figure 2 Retrieved from https://www.nationsreportcard.gov/mathematics/sample-questions/?grade=8 on 6/21/2023
Figure 3
Figure 3 shows the distribution of students' answers (by percent). Why might 25% of students click “median?” Maybe because they learned somewhere that the median is resistant to outliers and will not be as highly skewed as the mean will be. What about 16% of students saying the answer is the “maximum?” Misreading the question is my best guess, and that guess coincides with students who answered “range” as well. These are my guesses at best, who really knows why students chose them. But teachers can do this in their classroom and figure out what is happening fairly well. To me, doing this in the classroom is much more powerful than people crying over the results of a national exam that collected data just after a multi-year pandemic moved schools online for an extended period of time.
To the Task!
I made a quick activity to give students a little more room to interpret and create, and I think can provide opportunities to engage students in brief discussions about a similar problem from the NAEP exam. This activity has five different questions and asks students to input a number that answers the prompt, in the case of mean and median, there should only be 1 correct answer (and thus, not very exciting problems, but worth checking student understanding), in the case of the maximum, mode, and range, a variety of answers can be imputed by students, and the program should automatically evaluate it. I hope that after students complete a series of activities like this, they get creative in their answers and try to find holes in the automatic scoring code. I would bet that students often do not know they can get creative with their solutions, but students who do know this or are willing to submit an unusual response, are probably more confident in their math ability.
What if a student can submit a correct answer and the assessment code shows it is wrong? That could be a powerful discussion in the class and can be empowering to students who can successfully argue in favor of the proposed student solution. Other considerations are: is the student’s response really correct? Why might the code be incorrect? It is one thing to automatically score a question that has one and only one solution, for tasks where there are infinitely many solutions students can submit there is more room for error in the automatic assessment (and should be thoroughly tested by a team). Though I am fairly confident in this particular set of problems, in general, it is possible that I did not consider a set of correct solutions (I don’t have a team to test these out, it is just me). It could also be that the platform’s coding language has gaps. But as a formative assessment, the stakes on grades are low in terms of false negatives as these should not impact students’ grades but can be used to identify where students are in their understanding. However, the stakes on student learning can be high (and positive) if the whole class conversation yields engagement from all students in one way or another.
Here is the activity:
https://teacher.desmos.com/activitybuilder/custom/6493532cbb4ffc9588568e7a
Thanks for reading! Feel free to leave me feedback!